Node Debugger for Chrome: Debug Node in Chrome Devtools
Node Debugger for Chrome, developed by Apt-2531, is a free Chrome extension that allows developers to debug Node applications using Chrome Devtools. It provides a convenient way to connect to v8 inspector debugging instances and save configured debugging sessions for easy access.
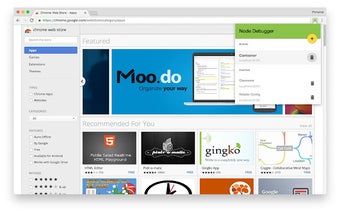
To get started, simply start a Node 6.3+ process with the --inspect flag set, which will initiate a debugging session at localhost:9229. Then, click on the Node Debugger extension icon in Chrome and check that the Default session is available. By selecting the Default session, a new Chrome window will load with the devtools connected to the Node application. This seamless integration enables developers to efficiently debug their Node applications without switching between different tools.
The Node Debugger for Chrome also has future plans to improve its functionality. It aims to detect when the debugger goes offline, which can happen frequently during development with Nodemon, and automatically reconnect to ensure uninterrupted debugging sessions.
With Node Debugger for Chrome, developers can streamline their debugging process and continue building great apps with ease.